Statistical Clustering Methods Uncover Reliable Patterns in Multi-Event Wagering Forecasts
Written by Theo Krause · Aug 8, 2026
Statistical Clustering Methods Uncover Reliable Patterns in Multi-Event Wagering Forecasts
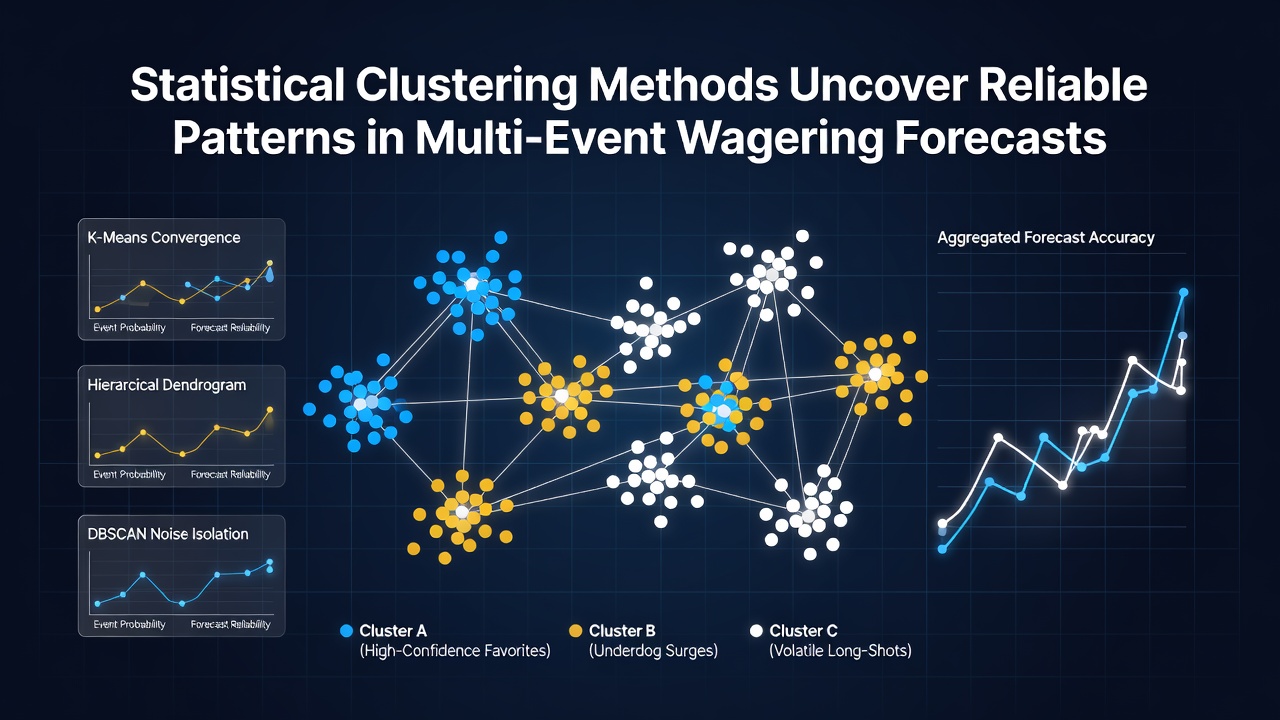
Statistical clustering methods have emerged as tools that group similar data points from large wagering datasets and reveal structures within multi-event forecast models. These techniques organize variables such as historical outcomes, odds movements, and event correlations into clusters that highlight recurring sequences across combined bets. Analysts apply algorithms including k-means, hierarchical clustering, and density-based spatial clustering of applications with noise to separate noise from meaningful groupings in sports and racing data streams.
Core Algorithms and Their Application to Wagering Data
K-means clustering partitions forecast records into a predefined number of groups based on distance metrics that measure similarity among features like stake distribution, event timing, and result variance. Researchers feed the algorithm normalized datasets drawn from thousands of multi-event wagers, after which the method iteratively assigns each observation to the nearest centroid until convergence occurs. Hierarchical clustering builds a tree of merges or splits that allows examination of cluster stability at different levels of granularity without requiring an initial specification of group count. Density-based methods identify clusters as regions of high point concentration while labeling isolated observations as outliers, which proves useful when wagering records contain irregular entries from low-volume events.
Data Preparation Steps Before Clustering
Analysts first compile variables from public and proprietary sources that include event start times, participant statistics, and market-implied probabilities. They then standardize these inputs to prevent scale differences from dominating distance calculations, apply dimensionality reduction techniques such as principal component analysis to retain the most informative axes, and remove duplicate or incomplete records that could distort cluster boundaries. In August 2026 several research teams published updated preprocessing pipelines that incorporated real-time odds feeds from multiple jurisdictions, allowing clusters to reflect current market conditions rather than static historical snapshots alone.
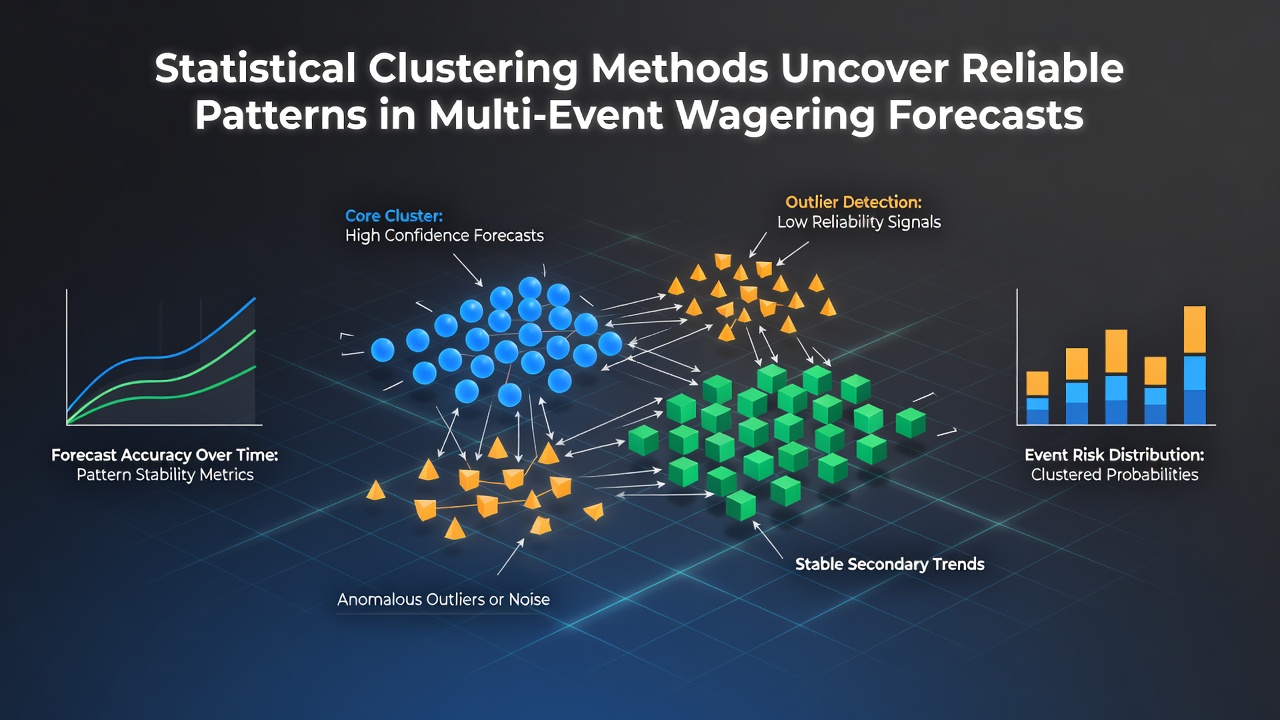
Once clusters form, forecasters examine the internal composition of each group to determine which combinations of events produce consistent co-occurrence patterns. For example, one cluster might contain multi-event sequences where underdog selections in separate leagues share similar pre-match volatility measures, while another cluster groups high-volume accumulator bets that exhibit correlated draw outcomes across different weekends. These groupings supply quantitative signatures that model builders can test against subsequent results to measure predictive lift.
Validation and Performance Metrics Across Studies
Validation relies on internal indices such as silhouette scores and Davies-Bouldin index values that quantify how well-separated the discovered clusters remain. External validation compares cluster assignments against known outcome categories when labeled data exist, although most wagering datasets remain unlabeled. Studies released by the University of Sydney's Centre for Gambling Research have tracked silhouette improvements after the addition of interaction terms between correlated sports markets, showing that joint modeling of football and tennis events can tighten cluster definitions. Figures from the Nevada Gaming Control Board annual statistical summaries indicate that operators increasingly log granular bet-type data, supplying the volume required for stable cluster estimation in multi-event products.
Researchers have observed that clusters derived from pre-match data sometimes shift when in-play updates arrive, prompting development of incremental clustering procedures that update assignments as new observations stream in. These dynamic approaches maintain continuity across successive time windows while allowing new clusters to emerge when market conditions change abruptly. One documented case involved accumulator forecasts on European football weekends where a cluster previously associated with home wins migrated toward draw-heavy groupings after a mid-season rule adjustment altered scoring distributions league-wide.
Integration With Existing Forecast Pipelines
Clustering outputs feed into downstream models as categorical features or as filters that restrict training data to observations sharing similar cluster membership. Ensemble methods combine multiple clustering runs with different random seeds or distance functions to produce consensus labels that reduce sensitivity to single-run artifacts. Industry reports from the European Gaming and Betting Association note that several operators now embed cluster-derived features within their internal risk engines, using them to flag accumulator combinations whose joint probability deviates from historical cluster norms.
Geographic variation appears in data availability and regulatory reporting requirements. Canadian provincial gaming authorities publish aggregated transaction logs that support national-scale clustering studies, whereas certain Australian state regulators release only anonymized summary tables that limit the granularity of event-level analysis. These differences influence the resolution at which reliable patterns can be recovered across jurisdictions.
Conclusion
Statistical clustering methods continue to supply structured ways to organize the complexity inherent in multi-event wagering forecasts. By grouping observations according to measurable similarity, analysts extract recurring sequences that support more precise probability estimates and risk assessments. Ongoing refinements in algorithm choice, data integration, and validation protocols sustain the utility of these approaches as datasets grow and market dynamics evolve.