Seasonal Data Layers Reveal How Weather Metrics Alter Selection Accuracy Across Equine Events, Soccer Fixtures and Tennis Circuits
Written by Iris Walter · Sep 16, 2026
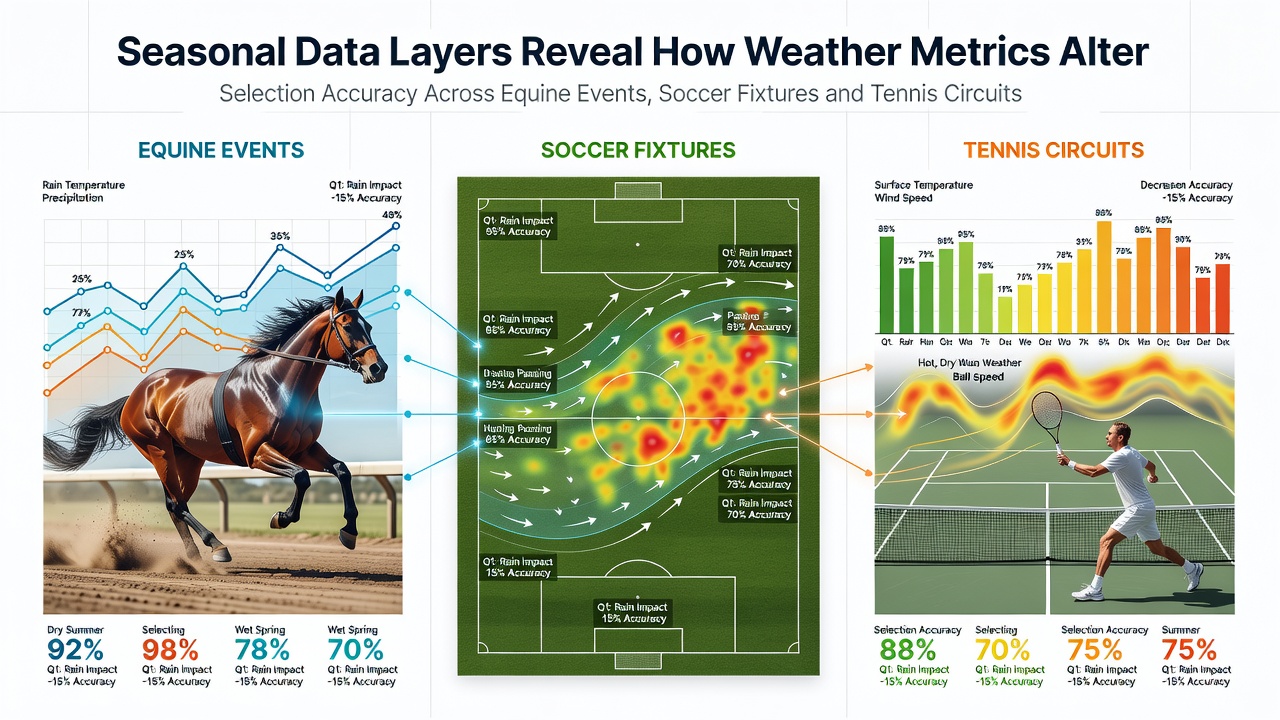
Seasonal Data Layers Reveal How Weather Metrics Alter Selection Accuracy Across Equine Events, Soccer Fixtures and Tennis Circuits
Weather metrics shift selection accuracy in equine events, soccer fixtures and tennis circuits through measurable seasonal patterns that data layers capture across multiple years. Analysts combine temperature records, precipitation totals, wind speed averages and humidity readings with performance outcomes to identify how conditions alter results in each sport. September 2026 data sets continue to highlight these interactions as autumn transitions affect late-season schedules in the northern hemisphere while southern circuits enter spring phases.
Equine Events and Track Surface Responses
Researchers track how rainfall alters turf and dirt surfaces in horse racing, which directly influences stride lengths and finishing times. Data layers from major tracks show that heavy precipitation increases going descriptions from firm to soft or heavy, reducing average speeds by up to 15 percent in documented cases. Temperature drops below 10 degrees Celsius correlate with tighter fields where favorites hold positions more consistently, according to aggregated race records. Wind patterns at exposed venues further modify outcomes when gusts exceed 25 kilometers per hour, favoring horses drawn on the inside rails in straight races.
Seasonal layering reveals stronger effects during spring and autumn transitions when ground conditions change rapidly between meetings. Studies compiled by the Australian Bureau of Meteorology demonstrate that consistent monitoring of soil moisture levels improves prediction models for race times across provincial and metropolitan fixtures. Observers note that summer heat waves above 30 degrees Celsius increase dehydration risks for runners, prompting trainers to adjust selection criteria toward proven performers in warmer climates.
Soccer Fixtures and Player Performance Metrics
Soccer outcomes respond to weather through impacts on ball trajectory, player stamina and pitch quality. Data sets from European leagues indicate that matches played in temperatures exceeding 28 degrees Celsius show a measurable decline in total distance covered by midfielders, reaching reductions of 8 to 12 percent. Rainfall above 5 millimeters per hour correlates with fewer successful passes in open play while increasing the frequency of long balls and set-piece opportunities. Wind speeds over 20 kilometers per hour affect high crosses and long-range shots, altering goal conversion rates in exposed stadiums.
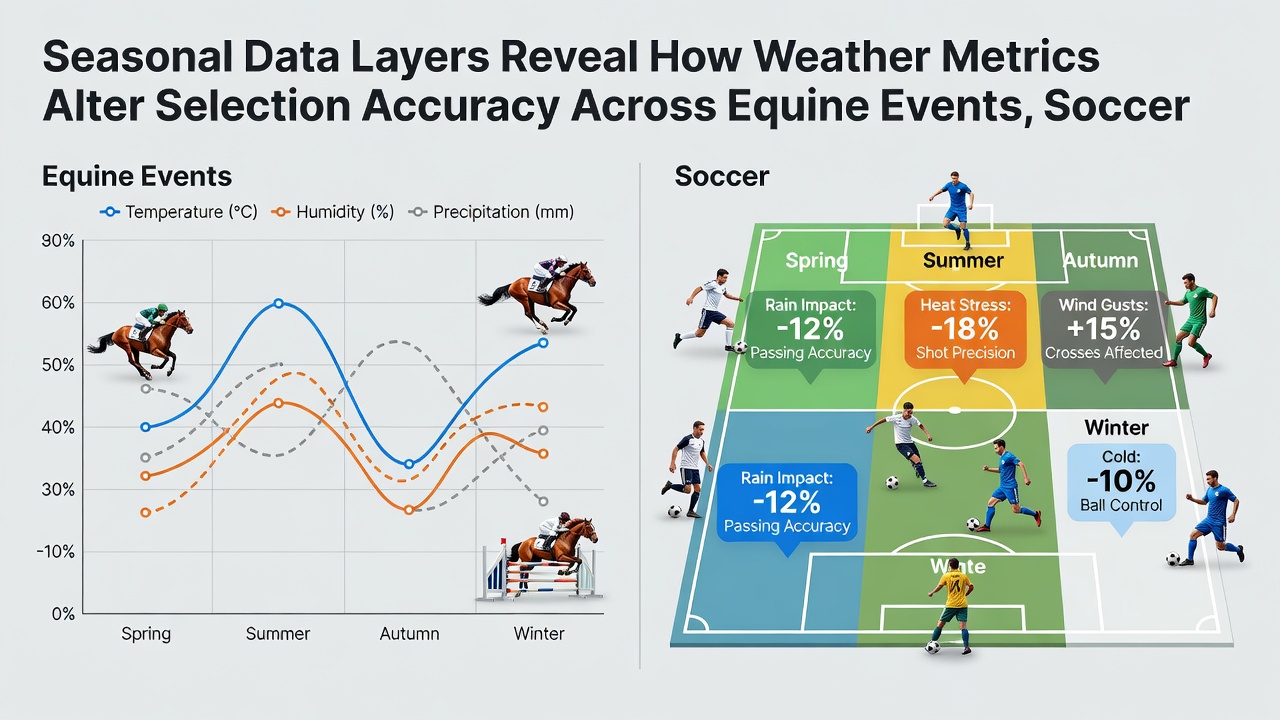
September 2026 fixtures in northern leagues coincide with cooling temperatures that favor teams adapted to variable conditions, while southern hemisphere schedules enter warmer periods. Layers combining historical humidity and precipitation data reveal patterns where teams from drier regions experience higher error rates in humid away matches. The European Environment Agency reports on climate variables support ongoing integration of these metrics into performance databases used by analysts. Such combinations help distinguish temporary weather effects from underlying team form when reviewing selection accuracy across domestic and continental competitions.
Tennis Circuits and Surface Interaction Data
Tennis performance data layers incorporate court surface responses to temperature, humidity and precipitation that modify ball bounce and player movement. Hard courts show reduced grip when surface temperatures exceed 35 degrees Celsius, increasing unforced error counts in baseline rallies according to ATP and WTA statistical archives. Clay surfaces retain moisture longer after light rain, slowing ball speeds and extending rally lengths, which shifts advantages toward players with superior endurance profiles. Wind affects serve accuracy most noticeably on outdoor grass and hard courts, with gusts above 15 kilometers per hour linked to higher double-fault percentages in recorded matches.
Seasonal data from circuits spanning multiple continents demonstrates that autumn events in Europe and North America coincide with falling temperatures that influence recovery times between matches. Humidity levels above 70 percent correlate with increased fatigue markers in best-of-five set formats during extended tournaments. Integration of these variables into selection models allows clearer separation of skill-based results from condition-driven variances, particularly during qualification rounds and early main-draw stages where player adaptation varies widely.
Cross-Sport Data Integration Patterns
Combined seasonal layers across equine, soccer and tennis events expose shared and distinct weather influences that refine accuracy in outcome forecasting. Temperature thresholds affect all three domains yet manifest differently: cooling conditions tighten equine fields, stabilize soccer passing networks and reduce tennis error rates on faster surfaces. Precipitation impacts track going in racing, pitch traction in soccer and court playability in tennis, with each requiring sport-specific thresholds for meaningful adjustment. Wind emerges as a common variable that modifies trajectories in all three, though measurement scales differ by venue exposure and event duration.
September 2026 continues to supply fresh data points as overlapping schedules in different hemispheres allow direct comparison of transitional weather effects. Analysts apply these layered records to refine models that account for both immediate conditions and longer-term seasonal trends, producing more stable accuracy metrics when evaluating selections across varied event types.
Conclusion
Seasonal data layers establish clear connections between weather metrics and selection accuracy in equine events, soccer fixtures and tennis circuits through consistent patterns documented across multiple seasons. Integration of temperature, precipitation, wind and humidity records with performance outcomes provides objective frameworks for understanding how conditions modify results in each sport. Ongoing collection during periods such as September 2026 strengthens these models by adding current observations to historical baselines, supporting refined analysis without reliance on subjective interpretation.